Integrated Appraisal of
Epidemiological Research
Evaluating Epidemiological Research
Learning objectives for this lesson:
- Read a published study as a structured sequence of inferential decisions
- Apply reporting frameworks (STROBE, CONSORT, PRISMA) to evaluate completeness
- Conduct stepwise critical appraisal: question clarity, design alignment, internal validity, statistical inference, and external validity
- Systematically identify selection bias, measurement error, and confounding threats
- Distinguish red flags from quality indicators in epidemiological publications
- Synthesize evidence across multiple studies, weighting by methodological rigor
- Apply disciplined skepticism grounded in the methodological knowledge built throughout this course
This course was developed by Dr. Kiffer G. Card, Faculty of Health Sciences, Simon Fraser University.
Glossary: Key Terms, People & Concepts
📚 Reference page, available throughout the lesson
This glossary collects the key concepts, frameworks, and biases you will use in this capstone lesson, and throughout your epidemiology career, to evaluate research. Type in the search box to filter entries.
Reading Studies as Structured Inference
Introduction and Overview
The capstone integrates the inferential machinery you have built across the term and connects it to a long methodological tradition, from Hill's (1965) viewpoints for distinguishing association from causation, through the evidence-based-medicine movement (Sackett et al., 1996), to the reporting-guideline and GRADE infrastructure that governs modern appraisal. Earlier lessons built up a working toolkit one layer at a time: the foundations of the discipline (an earlier lesson), evidence synthesis through systematic reviews (an earlier lesson), the four observational designs (earlier lessons), the conceptual foundations of measurement and causal specification (an earlier lesson), the full inventory of selection, information, design-specific, and confounding biases (earlier lessons). This capstone lesson is where the toolkit becomes a method. Across three content sections, you move from reading studies as inferential chains (this section: the seven decisions every paper makes, plus the STROBE / CONSORT / PRISMA reporting frameworks) to a five-stage stepwise appraisal procedure with a worked example (a later section) to red flags, quality indicators, and applied synthesis across conflicting studies (a later section). The final assessment (a later section) tests integrated appraisal skills across the whole course, and the Looking Forward note in the completion banner connects this work to what a later course will build on top of it.
Learning Objectives
- Reframe a published study as a sequence of seven inferential decisions: question, target population, causal model, design, measurement, analysis, interpretation.
- Identify which decision points carry the most weight for a given research question.
- Match the STROBE, CONSORT, and PRISMA reporting frameworks to observational, experimental, and review designs respectively.
- Use a reporting checklist to detect omissions that block critical appraisal even before the methods are evaluated.
From Passive Reading to Active Evaluation
Throughout this course, you have built a toolkit of methodological concepts: study design, bias, confounding, measurement, and statistical inference. In this capstone lesson, we integrate everything into a coherent framework for critically appraising epidemiological research.
Reading a study is not a passive act of absorbing conclusions. It is an active process of evaluating a chain of inferential decisions. Every published study represents a series of choices, each of which can introduce error, bias, or uncertainty. Your task as a critical reader is to identify those choices and assess whether they support the study’s conclusions. This stance is the methodological core of evidence-based medicine as articulated by Sackett, Rosenberg, Gray, Haynes, & Richardson (1996): integrating the best available external evidence with explicit, structured judgement rather than relying on authority or impression.
Core Principle
A study’s conclusions are only as strong as the weakest link in its inferential chain. Critical appraisal means systematically examining every link, from the research question through to interpretation, to determine where the chain might break.
The Inferential Chain
Every epidemiological study follows a logical sequence of decisions. When you read a paper, you are reconstructing and evaluating this chain. The seven flip cards below take you through the chain in order: research question, target population, causal model, study design, measurement, analysis, interpretation. As you click through them, notice that each step constrains the next: a vague research question makes every subsequent decision hard to evaluate, and a misspecified causal model can ruin even a well-executed analysis.
The inferential chain tells you what to evaluate. Standardised reporting guidelines tell you where to look in the paper for each piece of evidence, and, crucially, what is missing when it is missing. The three you will encounter most often are STROBE, CONSORT, and PRISMA, paired with the three main study-design families.
Reporting Frameworks as Evaluation Schemas
Reporting guidelines provide structured checklists for what information should be present in a published study. They serve as schemas that help you identify what is, and what is not, reported. The three tabs below match each framework to its corresponding family of designs: STROBE for observational studies (von Elm et al., 2007), CONSORT for randomised trials (Schulz, Altman, & Moher, 2010), and PRISMA 2020 for systematic reviews (Page et al., 2021).
STROBE (Strengthening the Reporting of Observational Studies in Epidemiology) provides a checklist for cohort, case-control, and cross-sectional studies. Key items include:
- Clear specification of study design in the title or abstract
- Description of eligibility criteria, sources, and methods of participant selection
- Definitions of all variables (exposures, outcomes, confounders) with measurement methods
- Explanation of how study size was determined
- Description of statistical methods, including confounding control
- Reporting of numbers at each stage (flow diagram), summary measures with confidence intervals
- Discussion of limitations including sources of potential bias
CONSORT (Consolidated Standards of Reporting Trials) is the gold standard for reporting randomized controlled trials. Key requirements include:
- Description of trial design (parallel, factorial, crossover), including allocation ratio
- Participant eligibility criteria and settings where data were collected
- Details of interventions for each group sufficient for replication
- Pre-specified primary and secondary outcomes with measurement methods
- Sample size determination including interim analyses and stopping rules
- Randomization method: sequence generation, allocation concealment, implementation
- Blinding details: who was blinded, method description
- CONSORT flow diagram showing enrollment, allocation, follow-up, and analysis
PRISMA (Preferred Reporting Items for Systematic Reviews and Meta-Analyses) guides reporting for evidence synthesis. Key requirements include:
- Structured research question (often using PICO format)
- Protocol registration details (e.g., PROSPERO)
- Complete search strategy for at least one database, reproducible enough to replicate
- Study selection process with inclusion/exclusion criteria
- Data extraction methods and risk of bias assessment tools used
- PRISMA flow diagram showing identification, screening, eligibility, and inclusion
- Synthesis methods and assessment of certainty of evidence (e.g., GRADE; Guyatt et al., 2008)
Important Distinction: Reporting Quality vs. Methodological Quality
Meta-research shows that adherence to reporting guidelines is associated with more complete reporting, but not necessarily lower bias or better design. A poorly designed study can be well-reported, and a well-designed study can be poorly reported. Reporting quality enables evaluation; it does not guarantee validity. You need complete reporting to judge a study, but completeness alone does not make a study trustworthy.
You are reading an observational cohort study examining the association between statin use and dementia risk in older adults. The abstract reports a hazard ratio of 0.72 (95% CI: 0.58–0.89). However, the methods section does not describe how statin use was measured (prescriptions filled? Self-report?), does not specify how dementia was ascertained, does not mention how confounders were selected, and reports no information about missing data.
Using STROBE as a schema, you can systematically identify what is missing: variable definitions, measurement methods, confounding control strategy, and missing data handling. The impressive-looking hazard ratio cannot be properly interpreted without this information.
1. What is the primary purpose of reporting guidelines like STROBE, CONSORT, and PRISMA?
2. A meta-research study finds that journals requiring STROBE adherence publish papers with more complete methods sections. Which conclusion is best supported?
3. In the inferential chain framework, which step involves determining whether confounders, mediators, and colliders are correctly specified?
Stepwise Critical Appraisal
Introduction and Overview
An earlier section named the seven decisions every paper makes and the three reporting frameworks that audit them. This section converts that conceptual material into a working procedure. The five stages below are how you actually move through a paper from start to finish, in the order that lets you catch problems before they propagate. Each stage maps directly onto material from earlier lessons, so you should recognize the underlying ideas as you work through them.
Learning Objectives
- Apply a five-stage stepwise appraisal procedure (question, design, internal validity, statistical inference, external validity) in the right order.
- Map each stage onto the relevant prior lessons (e.g., Stage 3 to the bias inventory of earlier lessons).
- Work through a worked example end-to-end and produce a structured written appraisal.
- Recognize when a study's weakest link makes its strongest claims unsupportable.
A Five-Stage Appraisal Framework
Critical appraisal is most effective when conducted systematically. Rather than reading a study and forming a vague impression, work through five distinct stages, each targeting a specific aspect of inferential quality. This framework integrates concepts from every preceding lesson in this course. The accordion below walks through each stage in order; the worked example that follows applies all five to a real-world COVID-era observational study.
Before evaluating methods, assess the question itself:
- Exposure: Is it well-defined and measurable? Could it be operationalized differently?
- Outcome: Is it specific and clinically or epidemiologically meaningful?
- Population: Is the target population clearly identified?
- Plausibility: Does the proposed relationship have biological or social plausibility? Is there prior evidence?
A well-specified question constrains the study design, measurement strategy, and analytic approach. If the question is vague, every subsequent decision becomes difficult to evaluate.
Does the study design appropriately address the research question?
- A question about causation is best addressed by an RCT or, when experiments are infeasible, a well-designed cohort study with strong confounding control.
- A question about prevalence calls for a cross-sectional design with probability sampling.
- A question about rare outcomes is efficiently addressed by a case-control study.
- A question requiring evidence synthesis calls for a systematic review or meta-analysis.
Ask: Would an alternative design have provided stronger evidence with fewer threats to validity? Design misalignment does not necessarily invalidate a study, but it limits the strength of conclusions that can be drawn.
This is the most detailed stage. Systematically identify potential biases using concepts from earlier lessons:
Selection processes:
- Was sampling representative or could selection bias have distorted results?
- Could collider bias have been introduced by conditioning on a common effect (e.g., restricting to hospitalized patients, adjusting for an intermediate variable)?
- Was there differential loss to follow-up or non-response?
Measurement error:
- Could differential misclassification have biased results toward or away from the null?
- Could non-differential misclassification have attenuated a true effect?
- Were validated instruments used? Were they validated in the study population?
Confounding control:
- Were confounders identified using a causal model (DAG) or only selected based on statistical significance?
- Could unmeasured or residual confounding remain?
- Were specification errors present (e.g., adjusting for mediators, adjusting for colliders, incorrect functional forms)?
Empirical reanalysis example: When Hernán and colleagues (2008) reanalysed the widely cited Women’s Health Initiative observational data using the same eligibility criteria and timing conventions as the RCT, the observational estimate for hormone therapy and heart disease shifted substantially, illustrating how selection processes and analytic choices can drive results.
Even with good design and minimal bias, statistical inference can go wrong:
- Model assumptions: Are distributional assumptions justified? Is the sample large enough for asymptotic methods?
- Uncertainty quantification: Are confidence intervals reported? Are they appropriately interpreted?
- Multiple testing: Were multiple comparisons made without correction? Were subgroup analyses pre-specified or post hoc?
- Model selection: Were many models fit and only the “best” reported? Could selective reporting inflate false positive rates?
- Effect sizes over significance: Does the study emphasize the magnitude and precision of effects, or does it reduce everything to p < 0.05 vs. p ≥ 0.05?
A study that reports “statistically significant” results with a hazard ratio of 1.02 (a 2% higher rate, real enough to detect in a large sample yet far too small to change any decision) and a narrow confidence interval has detected a precisely estimated trivial effect; statistical significance does not equal clinical or public health significance (Greenland et al., 2016).
External validity asks whether results apply beyond the study sample:
- Sample representativeness: Does the study sample represent the target population? Highly selected samples (academic medical centers, volunteer cohorts) may not.
- Contextual differences: Results from one healthcare system may not transport to another. Social determinants, cultural factors, and healthcare access differ across settings.
- Effect modification: If the exposure–outcome relationship varies across subgroups, transporting the average effect to a population with a different subgroup distribution could be misleading.
- Temporal validity: Medical practice, environmental exposures, and population characteristics change over time. Results from the 1990s may not apply today.
External validity turns on more than sample size. A large but highly selected sample may have less external validity than a smaller but representative one.
Applying the Framework: A Worked Example
A retrospective cohort study reports that patients with low serum vitamin D levels at hospital admission had 2.5 times the odds of ICU admission compared to those with sufficient levels (OR = 2.5, 95% CI: 1.4–4.5), adjusted for age, sex, and BMI.
| Appraisal Stage | Assessment |
|---|---|
| Question clarity | Reasonably clear: exposure (vitamin D level), outcome (ICU admission), population (hospitalized COVID patients) |
| Design alignment | Retrospective cohort using hospital records; appropriate for this question but has inherent limitations |
| Internal validity | Major concerns: collider bias (restricting to hospitalized patients conditions on a collider); confounding by illness severity (sicker patients may have lower vitamin D due to acute-phase response, not baseline deficiency); measurement timing (at admission, not pre-illness) |
| Statistical inference | Adjusted for only 3 confounders; likely residual confounding; no sensitivity analyses reported |
| External validity | Single hospital, limited generalizability; hospitalized population does not represent all COVID patients |
Conclusion: Despite a statistically significant and seemingly large effect, the inferential chain has several weak links, particularly collider bias (studying only already-hospitalized patients can manufacture a vitamin D and severity link that would not hold in the general population) and reverse causation (illness can itself lower vitamin D, so a low level may be a marker of being sick rather than a cause of getting sicker), that undermine causal interpretation.
Reflection
Think of a health study you have encountered in the news or in a course. Walk through the five appraisal stages. Which stage reveals the most significant threat to the study’s conclusions? How would you communicate this limitation to a non-expert audience?
1. A retrospective cohort study examines the association between hospital-acquired infections and mortality, restricting the analysis to ICU patients. What bias is most likely introduced by this restriction?
2. A study reports p = 0.03 for its primary outcome but tested 20 secondary outcomes without correction for multiple comparisons. What is the most appropriate concern?
3. A well-conducted RCT of a blood pressure medication is conducted exclusively at academic medical centers with highly selected, adherent patients. Which validity concern is most relevant?
Red Flags, Quality Indicators, and Applied Synthesis
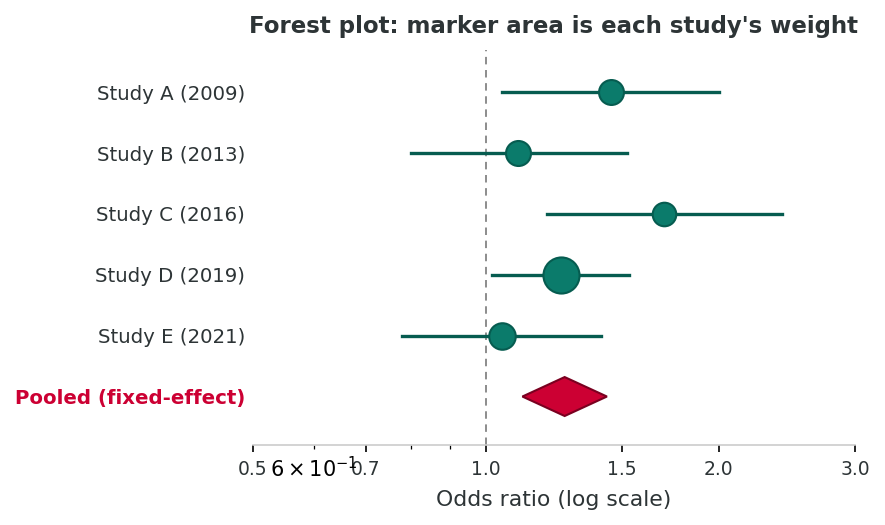
Inverse-variance pooling
Studies with smaller standard errors contribute more weight. A pooled estimate can still be a precise estimate of a biased number if the underlying studies share a common flaw. The appraisal from earlier sections is the prerequisite for any synthesis.
Introduction and Overview
An earlier section gave you a step-by-step procedure for working through a single paper. This section adds two complementary tools: pattern-recognition for warning signs that cut across study types, and a procedure for synthesising evidence when multiple studies disagree. The cards below are not a substitute for the five-stage appraisal; they are heuristics that flag which papers warrant the most careful working through.
Learning Objectives
- Recognize common red flags, such as implausible effect sizes, inconsistent sample sizes, lack of transparency, post-hoc subgroups, and mediator adjustment, across study designs.
- Identify quality indicators (pre-registration, transparent methods, sensitivity analyses, replication) that warrant heightened trust in a study.
- Synthesize evidence across multiple studies, weighting by methodological rigor rather than counting positive results.
- Articulate calibrated uncertainty: state what the evidence does and does not support, and where residual uncertainty is greatest.
Red Flags in Published Research
With experience, certain patterns signal that a study’s results may be less trustworthy than they appear. These are not definitive disqualifiers, but they warrant heightened scrutiny. Ioannidis (2005) showed analytically why: small samples, flexible designs, multiple teams chasing significance, and selective reporting all inflate the rate of false positives, sometimes to the point where most published findings in a field are wrong. The replication crisis that followed makes the red flags below worth memorising.
Red flags are warning signs. The flip side, the features that increase confidence in a paper, are the quality indicators below. Read them as the positive checklist that should accompany the negative one.
Quality Indicators
Just as red flags suggest potential problems, certain features indicate methodological rigor and transparency.
| Quality Indicator | Why It Matters |
|---|---|
| Explicit DAGs or causal diagrams | Shows the investigators have thought carefully about causal structure, confounders, mediators, and colliders before analyzing data |
| Transparent, complete reporting | Follows reporting guidelines; includes flow diagrams, all pre-specified analyses, and both positive and null results |
| Validated measurement instruments | Indicates exposure and outcome were measured using tools with established reliability and validity in the study population |
| Analytic strategy aligned with design | Statistical methods appropriate for the data structure (e.g., survival analysis for time-to-event, multilevel models for clustered data) |
| Sensitivity and bias analyses | Tests robustness of results to alternative assumptions (e.g., E-values for unmeasured confounding, which quantify how strong a hidden confounder would need to be to explain away the result (VanderWeele & Ding, 2017); quantitative bias analysis for misclassification) |
| Open science practices | Pre-registration, data sharing, open-access code, and registered reports reduce opportunities for selective reporting |
The companion R script r-activities/HSCI_230_Lesson_12_Integrated_Appraisal_of_Epidemiological_Research.R walks you through a first-look fixed-effect meta-analysis: starting from three published ORs and their 95% CIs, you derive log-OR standard errors, compute inverse-variance weights, and pool the studies into a single summary OR with a CI, then cross-check the calculation against metafor::rma(). As the capstone activity, it makes the central appraisal point concrete: pooling only makes sense after each input study has survived the five-stage appraisal you learned in an earlier section.
Critical appraisal often ends with the question: given several studies, what does the evidence as a whole say? A simple inverse-variance fixed-effect meta-analysis is just a few lines of code.
# Three hypothetical studies of exposure E and outcome Y
study  <- c("Study A", "Study B", "Study C")
or     <- c(1.40, 1.10, 1.55)
lci    <- c(1.05, 0.85, 1.10)
uci    <- c(1.85, 1.43, 2.18)

# SE of log-OR derived from the published 95% CI
log_or <- log(or)
log_se <- (log(uci) - log(lci)) / (2 * 1.96)
w      <- 1 / log_se^2                         # inverse-variance weights

# Pooled log-OR and 95% CI
pool_log <- sum(w * log_or) / sum(w)
pool_se  <- sqrt(1 / sum(w))
pool_or  <- exp(pool_log)
pool_ci  <- exp(pool_log + c(-1, 1) * 1.96 * pool_se)
round(c(pooled_OR = pool_or, lower = pool_ci[1], upper = pool_ci[2]), 2)Synthesis is a tool, not a verdict. A pooled OR of 1.30 (1.10-1.53) suggests a real but modest association. But the meta-analysis only makes sense if the underlying studies are themselves trustworthy; the appraisal you just learned is the prerequisite.
R Reflect on what you just ran
Use the questions below to interpret the output you produced. Look at your console before answering.
1. The three individual ORs were 1.40 (Study A), 1.10 (Study B), and 1.55 (Study C). The pooled OR came out at 1.30. Which study contributed the most weight to the pooled estimate, and how can you tell that from the published CIs alone (without seeing the raw w values)?
2. The pooled 95% CI (1.10-1.53) is narrower than any of the three individual study CIs. Why does pooling tighten the CI, and what assumption about the underlying studies must hold for that narrower CI to be a fair summary?
3. Suppose Study A had used a cross-sectional design with weak confounder control and Study C had used a prospective cohort with strong adjustment. Why does the lesson warn that a precise pooled OR can be "a precise estimate of a biased number," and how does that warning change how you would report this result?
Applied Synthesis: Evaluating Conflicting Evidence
In practice, you will encounter studies that reach different conclusions about the same question. Synthesis requires comparing studies on their results and on their methodological rigor.
Consider two studies examining the association between screen time and depressive symptoms in adolescents:
| Feature | Study A | Study B |
|---|---|---|
| Design | Cross-sectional survey | Prospective cohort, 2-year follow-up |
| Sample | n = 50,000 (convenience sample via online platform) | n = 3,200 (population-based, probability sample) |
| Exposure measure | Single question: “How many hours per day do you use screens?” | Validated time-use diary collected at 3 time points |
| Outcome measure | Single-item mood rating | PHQ-A (validated depression screener) |
| Confounders adjusted | Age and sex only | Age, sex, SES, parental mental health, physical activity, sleep, prior depression |
| Reported effect | r = 0.35, p < 0.001, “Strong link” | β = 0.04, 95% CI: −0.02 to 0.10, “Minimal association” |
Synthesis: Study A has a far larger sample but weaker design (cross-sectional, convenience sample, crude measures, minimal confounding control). Study B is smaller but has stronger design, better measurement, temporal ordering, and comprehensive confounding control. A rigorous synthesis would weight Study B’s evidence more heavily despite the smaller sample and less dramatic effect size.
Key Integration Principle
Evidence evaluation is probabilistic, not binary. No single study is perfect; no single study is worthless. The goal is to synthesize across studies, weighting each by its methodological rigor, and to exercise disciplined skepticism grounded in methodological knowledge rather than blanket dismissal or uncritical acceptance. Formal frameworks such as GRADE (Guyatt et al., 2008) and the Cochrane RoB 2 tool for trials (Sterne et al., 2019) operationalise this idea: they rate certainty on a continuum rather than declaring a single study right or wrong.
What Disciplined Skepticism Is Not
Disciplined skepticism is not cynicism or nihilism about research. It does not mean dismissing every study because “it’s just observational” or “you can prove anything with statistics.” Rather, it means applying the specific analytical skills you have developed in this course to identify precisely where evidence is strong and where it is uncertain, and calibrating your confidence accordingly.
Research Integrity: Why Critical Appraisal Matters
The clearest illustration of why appraisal cannot be outsourced is the Wakefield MMR-autism fraud. Wakefield et al.’s (1998) case series in The Lancet claimed an association between MMR vaccination and autism. Internal validity threats, including a tiny convenience sample, selective ascertainment, undisclosed conflicts of interest, and fabricated data, were visible on appraisal long before the paper was formally retracted twelve years later (The Lancet, 2010). Trained appraisers identified the problems early; uncritical citation propagated a public-health harm that persists today.
Reflection
Consider a health topic where you have seen conflicting media headlines (e.g., coffee and health, red meat and cancer). How would you apply the synthesis principles from this section to resolve the apparent conflict? What methodological features would you prioritize in deciding which evidence to weight most heavily?
1. A cross-sectional study of a common dietary exposure reports an odds ratio of 8.3 for a common chronic disease. What should be your first reaction?
2. A study adjusts for blood pressure when estimating the effect of sodium intake on stroke risk. Why is this problematic?
3. Which of the following best represents disciplined skepticism?
4. When two studies on the same topic reach different conclusions, what is the most rigorous approach to synthesis?
Final Assessment
Bringing It All Together
This course began with the foundations of epidemiology and ends here, with a working method for reading any paper the discipline produces. An earlier lesson framed the field historically, ethically, and methodologically; an earlier lesson introduced evidence synthesis through systematic reviews; earlier lessons laid out the four observational designs; an earlier lesson anchored measurement and causal specification; earlier lessons inventoried selection, information, design-specific, and confounding biases. This lesson turned that toolkit into a procedure: read the paper as an inferential chain (an earlier section), work through it in five stages (an earlier section), and synthesise across studies with calibrated uncertainty (an earlier section). What remains is to put that procedure into practice.
The capstone reflection below is unlike any other reflection in this course. It asks you to articulate not what you learned but how your reading of epidemiological evidence has changed, and how you will use that capacity going forward. Write it carefully: what you say here is your working stance as a critical reader of public-health research, and it should be specific enough that you can return to it after the assessment with a sense of where you started. The 15-question final assessment then tests integrated appraisal skills across the whole course; achieving 100% completes this course and clears the way to a later course, where the same skills move from observational into experimental territory.
Key Takeaways from this lesson
- A study's conclusions are only as strong as the weakest link in its inferential chain. Appraisal means systematically examining every link.
- STROBE, CONSORT, and PRISMA are not bureaucratic checklists but audit tools for whether the paper has reported enough to be evaluable.
- The five-stage appraisal procedure (question, design alignment, internal validity, statistical inference, external validity) maps onto the entire 12-lesson arc of this course.
- Red flags are heuristics, not verdicts: they flag which papers deserve the most careful working through.
- Synthesis across studies should weight by methodological rigor, not by counting significant results.
- The goal of critical appraisal is calibrated uncertainty, an articulated view of what the evidence does and does not support, and where residual uncertainty is greatest.
Capstone Assessment
Complete the comprehensive reflection below, then answer the 15-question final assessment. You must achieve 100% to complete the lesson. Take your time; this is your opportunity to demonstrate the critical appraisal skills you have developed throughout this course.
Reflection
Reflect on your journey through this course. Consider: (1) How has your approach to reading epidemiological research changed since the beginning of the course? (2) What is the most important methodological concept you have learned, and how does it change the way you evaluate health evidence? (3) Looking ahead, how will you apply critical appraisal skills in your academic work, professional career, or daily encounters with health claims in the media?
Final Knowledge Assessment
1. In the inferential chain framework, what is the most critical consequence of a poorly specified research question?
2. A case-control study investigates whether pesticide exposure is associated with Parkinson’s disease. Cases are asked to recall their occupational pesticide exposure over the past 20 years. What bias is of greatest concern?
3. STROBE is to observational studies as CONSORT is to:
4. A study of a new cancer drug reports a statistically significant hazard ratio of 0.98 (95% CI: 0.97–0.99, p = 0.001) for overall survival. What is the best interpretation?
5. A researcher selects confounders for adjustment by including all variables associated with the outcome at p < 0.20 in bivariate analysis. What is the primary concern with this approach?
6. A prospective cohort study finds that people who take daily multivitamins have 30% lower cardiovascular mortality. The study adjusts for age, sex, income, and education. What unmeasured confounder is most likely responsible for residual confounding?
7. Which of the following is a collider in the context of studying the relationship between genetic risk and environmental exposure on disease?
8. A study reports findings from 15 subgroup analyses, one of which shows a significant interaction (p = 0.04). None of the subgroup analyses were pre-specified. The correct interpretation is:
9. An E-value of 3.2 for the point estimate of a study means:
10. A cross-sectional study reports that “social media use causes increased anxiety among adolescents.” This statement is problematic because:
11. Non-differential misclassification of a binary exposure typically biases the estimated association:
12. A systematic review includes only English-language publications and excludes grey literature. What is the most likely consequence?
13. A pre-registered study protocol specifies adjustment for age, sex, SES, and smoking status. The published paper additionally adjusts for physical activity, alcohol use, and dietary quality without explanation. This is a concern because:
14. When synthesizing evidence across studies, which principle best captures the appropriate approach?
15. A study reports no sensitivity analyses, no discussion of missing data handling, no DAG, no assessment of model assumptions, and recommends sweeping policy changes based on a single cross-sectional analysis. This study primarily exhibits:
Course Capstone: Key Takeaways
- Read studies as structured inference processes: evaluate every link in the chain from question to interpretation.
- Reporting guidelines (STROBE, CONSORT, PRISMA) enable evaluation but do not guarantee validity.
- Apply five-stage appraisal: question clarity, design alignment, internal validity, statistical inference, external validity.
- Watch for red flags: implausible effect sizes, inconsistent data, lack of transparency, post hoc subgroups, mediator adjustment, and interpretive overreach.
- Recognize quality indicators: DAGs, validated instruments, sensitivity analyses, open science practices.
- Synthesize evidence probabilistically, weighting by rigor rather than counting studies or chasing significance.
- Practice disciplined skepticism grounded in methodological knowledge, not cynicism.
References
Greenland, S., Senn, S. J., Rothman, K. J., Carlin, J. B., Poole, C., Goodman, S. N., & Altman, D. G. (2016). Statistical tests, P values, confidence intervals, and power: a guide to misinterpretations. European Journal of Epidemiology, 31(4), 337–350. https://doi.org/10.1007/s10654-016-0149-3
Guyatt, G. H., Oxman, A. D., Vist, G. E., Kunz, R., Falck-Ytter, Y., Alonso-Coello, P., & Schünemann, H. J. (2008). GRADE: an emerging consensus on rating quality of evidence and strength of recommendations. BMJ, 336(7650), 924–926. https://doi.org/10.1136/bmj.39489.470347.AD
Hernán, M. A., Alonso, A., Logan, R., Grodstein, F., Michels, K. B., Willett, W. C., Manson, J. E., & Robins, J. M. (2008). Observational studies analyzed like randomized experiments: an application to postmenopausal hormone therapy and coronary heart disease. Epidemiology, 19(6), 766–779. https://doi.org/10.1097/EDE.0b013e3181875e61
Hill, A. B. (1965). The environment and disease: Association or causation? Proceedings of the Royal Society of Medicine, 58(5), 295–300. https://doi.org/10.1177/003591576505800503
Ioannidis, J. P. A. (2005). Why most published research findings are false. PLoS Medicine, 2(8), e124. https://doi.org/10.1371/journal.pmed.0020124
Page, M. J., McKenzie, J. E., Bossuyt, P. M., Boutron, I., Hoffmann, T. C., Mulrow, C. D., et al. (2021). The PRISMA 2020 statement: an updated guideline for reporting systematic reviews. BMJ, 372, n71. https://doi.org/10.1136/bmj.n71
Sackett, D. L., Rosenberg, W. M. C., Gray, J. A. M., Haynes, R. B., & Richardson, W. S. (1996). Evidence based medicine: what it is and what it isn’t. BMJ, 312(7023), 71–72. https://doi.org/10.1136/bmj.312.7023.71
Schulz, K. F., Altman, D. G., & Moher, D. (2010). CONSORT 2010 statement: updated guidelines for reporting parallel group randomised trials. BMJ, 340, c332. https://doi.org/10.1136/bmj.c332
Sterne, J. A. C., Savović, J., Page, M. J., Elbers, R. G., Blencowe, N. S., Boutron, I., et al. (2019). RoB 2: a revised tool for assessing risk of bias in randomised trials. BMJ, 366, l4898. https://doi.org/10.1136/bmj.l4898
The Lancet. (2010). Retraction: Ileal-lymphoid-nodular hyperplasia, non-specific colitis, and pervasive developmental disorder in children. The Lancet, 375(9713), 445. https://doi.org/10.1016/S0140-6736(10)60175-4
VanderWeele, T. J., & Ding, P. (2017). Sensitivity analysis in observational research: introducing the E-value. Annals of Internal Medicine, 167(4), 268–274. https://doi.org/10.7326/M16-2607
von Elm, E., Altman, D. G., Egger, M., Pocock, S. J., Gøtzsche, P. C., & Vandenbroucke, J. P. (2007). The Strengthening the Reporting of Observational Studies in Epidemiology (STROBE) statement: guidelines for reporting observational studies. The Lancet, 370(9596), 1453–1457. https://doi.org/10.1016/S0140-6736(07)61602-X
Wakefield, A. J., Murch, S. H., Anthony, A., Linnell, J., Casson, D. M., Malik, M., et al. (1998). [Retracted] Ileal-lymphoid-nodular hyperplasia, non-specific colitis, and pervasive developmental disorder in children. The Lancet, 351(9103), 637–641. https://doi.org/10.1016/S0140-6736(97)11096-0